Power BI Certification Training Course

Ratings: 4.9 - 2,765 reviews
Rated 5 out of 5

CourseJet's Power BI Online Training helps learners develop skills in business intelligence, data analysis and interactive reporting using Microsoft Power BI. This 100% live online instructor-led training introduces Power BI Desktop, Power Query, Data Analysis Expressions (DAX), data modelling, Power BI Service and dashboard development. Learners explore how to connect multiple data sources, clean and transform information, create relationships between tables and develop visual reports that support business decisions. The course also introduces data refresh, report sharing and security concepts. Power BI training is suitable for aspiring data analysts, business intelligence professionals, Excel users, finance specialists and IT professionals interested in data-driven reporting. Through interactive sessions, CourseJet helps learners understand practical reporting workflows, analytical calculations and dashboard design principles, supporting professional development in business intelligence and data analytics.

2987+

Total Learners

30 Hrs

Course Duration

15 Hrs

Assignments Duration

100%

Job Oriented Training

24/7

Students Support

CourseJet's Training Modes

Learn from World’s top Power BI Certified faculty and industry leaders

Online Batch Training

One To One Training

Customized Training

Fast Track Training

Corporate Training

Upcoming Batch Schedule

Check out our Power BI online certification batch timings. Does this batch not suits your timings? No worries, we will customize and arrange the batch timings that match you perfectly to your interest.

02-11-2026

Weekdays Regular (Class 1Hr - 1:30Hrs) / Per Session. (Monday - Friday) Time: 08:00 AM (IST)
WEEK DAY

31-10-2026

Weekend Regular (Class 3Hrs) / Per Session. (Saturday - Sunday) 11:00 AM (IST)
Week End

05-11-2026

Weekdays Regular (Class 1Hr - 1:30Hrs) / Per Session. (Monday - Friday) Time: 08:00 AM (IST)
WEEK DAY

01-11-2026

Weekend Regular (Class 3Hrs) / Per Session. (Saturday - Sunday) 11:00 AM (IST)
Week END

02-11-2026

Weekdays Fast-track (Class 3Hrs - 4Hrs) / Per Session. (Monday - Friday) 10:00 AM (IST)
FAST TRACK

31-10-2026

Weekend Fast-track (Class 5Hrs - 6Hrs) / Per Session. (Saturday - Sunday) 11:00 AM (IST)
Fast Track

Can’t find a batch you were looking for?

Get Flexible Batch Timings according to your Interest 

Best Power BI Certification Online Course

Power BI Online Training introduces Microsoft’s business intelligence platform, which enables organisations to connect, transform, analyse and visualise information from different data sources. Power BI helps users convert raw data into interactive reports that support operational monitoring and business decision-making. The platform includes Power BI Desktop for report development, Power Query for data preparation, DAX for analytical calculations and Power BI Service for publishing and managing reports. Learners also explore semantic models, relationships, measures and interactive visualisations.

Important technical concepts include Extract, Transform, Load (ETL), data modelling, star schema design, filter context, row context and report-level interactions. These capabilities help analysts create reliable calculations and present business information clearly. Power BI is used in finance, retail, healthcare, manufacturing, marketing and other industries for sales analysis, financial reporting, inventory monitoring, operational dashboards and performance measurement. CourseJet’s live online instructor-led training helps learners understand the complete reporting workflow, from connecting data sources to preparing analytical models and developing dashboards. These skills are relevant to individuals interested in business intelligence development, data analysis and reporting-related careers

Benefits of Learning Power BI at CourseJet

Looking for Hands-On Training?

Get Practical Assignments and Real time projects

Drop us a Query

About Power BI Course

Microsoft Power BI is a business intelligence and analytics platform used to transform data into meaningful reports and interactive visualisations. It enables organisations to connect information from databases, spreadsheets, cloud services and other supported sources, helping users analyse business performance. Power BI Desktop provides tools for connecting data, developing semantic models and designing reports. Power Query supports data extraction and transformation through a graphical interface and the M formula language. Analysts can clean datasets, combine information and prepare structured tables for reporting. Data modelling is an important part of Power BI development. Relationships connect tables, while star schema design helps organise facts and dimensions. DAX provides a calculation language for measures, calculated columns and advanced analytical expressions. 

Understanding evaluation context is essential for creating accurate calculations.Power BI reports can include charts, matrices, cards, slicers, maps and interactive filtering. Features such as drill-through, bookmarks and conditional formatting help users investigate information and communicate findings effectively. Power BI Service supports report publishing, collaboration, data refresh and access management. Row-level security can restrict data visibility according to defined roles. In professional environments, Power BI developers combine data preparation, modelling, calculations and visual design to create reporting solutions for finance, sales, operations, marketing and management teams.

The main objective of Power BI training is to help learners understand business intelligence workflows and develop the technical skills required to prepare data, create analytical models and design interactive reports.

The training introduces Power BI Desktop, Power Query, DAX, data modelling and Power BI Service. Learners can work towards the following objectives:

  • Understand Power BI fundamentals: Explain the purpose of Power BI Desktop, Power BI Service and semantic models.
  • Connect and transform data: Use Power Query concepts to import, clean, filter, merge and transform information.
  • Develop data models: Understand table relationships, star schemas, fact tables and dimension tables.
  • Create DAX calculations: Develop knowledge of measures, calculated columns, filter context and common analytical functions.
  • Design interactive reports: Explore charts, matrices, slicers, drill-through and report interactions.
  • Analyse business performance: Understand how to calculate and present key performance indicators and trends.
  • Publish and manage reports: Explore Power BI Service workspaces, sharing and scheduled refresh.
  • Understand data security: Learn the principles of row-level security and controlled access to analytical information.

Power BI training can help learners develop technical knowledge relevant to business intelligence, data analysis and reporting. Organisations across finance, retail, healthcare, manufacturing and technology use Power BI to monitor performance and analyse business information. Learners with suitable technical foundations may explore positions such as Junior Data Analyst, Reporting Analyst, Business Intelligence Analyst or Power BI Developer.

Experienced professionals may pursue responsibilities involving semantic model development, advanced DAX calculations, dashboard architecture and enterprise reporting. Power BI knowledge complements SQL, Microsoft Excel, data warehousing, statistics and business analysis. Familiarity with Microsoft Fabric, cloud data platforms and data engineering concepts can further strengthen professional capabilities. Career development depends on analytical ability, practical reporting experience, business knowledge and employer requirements. Completing training can support professional development but does not guarantee employment or promotion.

Power BI training is suitable for individuals interested in data analysis, reporting and business intelligence technologies.

  • Aspiring data analysts: Develop knowledge of data preparation, modelling and visualisation.
  • Business intelligence professionals: Strengthen report development and analytical modelling skills.
  • Excel users: Extend spreadsheet-based analysis into interactive reporting.
  • SQL developers: Learn how database information is used in business intelligence solutions.
  • Finance professionals: Explore financial dashboards, budgeting reports and performance analysis.
  • Sales and marketing analysts: Understand customer, campaign and revenue reporting.
  • Business analysts: Learn how to present business requirements and performance indicators visually.
  • IT professionals: Develop knowledge of data integration and analytical reporting platforms.
  • Operations professionals: Explore dashboards for monitoring productivity and operational performance.
  • Database administrators: Understand how structured data sources support reporting and analysis.

Beginners can start learning Power BI without previous experience of the platform. However, basic computer skills and familiarity with spreadsheets are recommended.Knowledge of Microsoft Excel, tables, formulas and data analysis can help learners understand reporting concepts more quickly. SQL knowledge is useful when working with relational databases but is not essential for introductory Power BI topics. An understanding of business metrics, data types and basic statistics can also support analytical learning.

Learners should have a computer and reliable internet access. Power BI Desktop is primarily a Windows application, so operating system compatibility and any software installation requirements should be confirmed before training.

CourseJet typically conducts Power BI training in small batches of two to three learners. This arrangement provides opportunities for direct instructor interaction and focused explanations of technical concepts. Smaller groups can help learners clarify questions about Power Query transformations, DAX calculations, data modelling and dashboard design.

CourseJet also offers one-to-one instructor-led training for participants who prefer individual attention and a more personalised learning experience. The availability of specific batches, training timings and one-to-one arrangements depends on instructor schedules. Learners should contact CourseJet to confirm their preferred learning format and available sessions before enrolment.

Launch your dream career Now!

Get personalized career coaching & mentors from industry

Power BI Course Curriculum

Our Power BI Course Curriculum encompasses all the course modules with a clear description and the concepts covered in each module. CourseJet designs the syllabus in the learner's perspective to provide comprehensive knowledge.

Data Visualization is the most prominent technique used to represent the data in a graphical way. It provides ways to produce images that represent relationships among the different data formats to help the viewers gain knowledge of data insights through images. You will also learn how to make use of data visualization tools to visualize data faster.

Topics Covered in this module are:

  • Introduction to Data Visualization
  • Visual Analysis
  • Custom Visuals
  • Data Visualization tools
  • Reports, Charts, Graphs
  • How to visualize unrelated data using visual analytics
  • What are the visual elements
  • Advantages of Data Visualization

Power BI is the most prominently used Data Visualization tool in the field of business analytics. It is a business analytics solution developed by Microsoft that is mainly used to transform and analyze enterprise data into rich visuals in the form of reports or dashboards. Power BI helps organizations view their data entirely through a single glass pane. Reports, graphs, Dashboards are the key elements of Power BI that are used to turn unrelated data sources into useful insights of data.

Topics Covered in this module are:

  • Introduction to Power BI 
  • Data Visualization
  • Business Analytics
  • Various analytics Services
  • Key features of Power BI
  • Data Visualization tools
  • Visual Elements
  • How to visualize data using Power BI
  • Key elements of Power BI
  • Different Power BI Products

Power BI is a business analytics solution developed by Microsoft that is mainly used to transform and analyze enterprise data into rich visuals in the form of reports or dashboards. In this module, you will learn how to extract data from the Web Pages or Power BI Visualizations. Power BI helps many organizations to extract hidden data insights from the unrelated data. 

Topics Covered in this module are:

  • Overview of Data Extraction
  • Use of Filters to extract data
  • How to extract data from web pages
  • How to import and export data from databases
  • Multiple Data Resources
  • Data Flow in Power BI 
  • How to extract data from large files

Data Visualization is the most prominent technique used to represent the data in a graphical or pictorial way. It provides ways to produce images that represent relationships among the different data formats to help the viewers gain knowledge of data insights through images. You will also learn how to make use of data visualization tools to visualize data faster. You will also learn about how the data can be visualized using visual analytics in Power BI. Data Visualization allows users or decision-makers to have a look at analytics that are presented visually. 

Topics Covered in this module are:

  • Introduction to Data Visualization
  • Visual Analysis
  • Custom Visuals
  • Data Visualization tools
  • Reports, Charts, Graphs
  • How to visualize unrelated data using visual analytics
  • What are the visual elements
  • Advantages of Data Visualization
  • Essential features of visual analytics

Microsoft Power Query is a Data Preparation and Data connectivity technology that mainly enables business users to access the stored data from a number of data sources and design as per the needs. Using Power BI you can search for data and share and manage queries in your organizations. Power Query provides the user interface to define date shape and transformation steps with user actions. These steps run every time when a query gets refreshed. 

Topics Covered in this module are:

  • What is Power Query
  • Data Transformations
  • What is Query Editor
  • M Advanced Data Transformation techniques
  • How to transform data in Power BI
  • Key features of Power Query
  • Various Custom functions

Data Analytic Expressions are in the form of formulas and expressions that are mainly used in data calculations and analysis. These DAX expressions are the combination and collection of constants, functions, and operators that are tested as a single formula to get results. This DAX expression is used by many data visualization tools and Power BI. 

Topics Covered in this module are:

  • Introduction to DAX 
  • DAX functions
  • DAX Syntax
  • DAX Query
  • Creating DAX Queries
  • DAX vs SQL
  • Use of Data Analytic Expressions for Data Analysis
  • Advantages of using DAX expressions in Power BI

Power BI Desktop is a free application by Microsoft that you can install on your desktops to connect, visualize, and transform your data. Using Power BI, you can connect with various data sources and mix them up into a single data model. Power BI desktop is also used to create reports that are the group of collections. You even can clean the data to build effective data models. 

Topics Covered in this module are:

  • Overview of Microsoft Power BI Desktop
  • How to discover data easily using Power BI Desktop
  • Comparison between Power BI and Power BI Desktop
  • How to visualize data on Power BI Desktop
  • Advancements in Power BI Desktop
  • Key features of Power BI Desktop
  • Advantages of using Power BI Desktop

In Power BI, the Power Q&A can be used to gain hidden insights into your data by using natural language. The Q&A feature in Power BI will provide a way towards Artificial Intelligence. In all the Power BI reports the Q&A feature is incorporated within them. Everything in Power BI is represented in the form of reports and charts.

Topics Covered in this module are:

  • What is the use of Power Q&A in Power BI
  • How to explore data using Q&A
  • Creating Data Visuals using Power Q&A
  • Natural Programming Language
  • Power Q&A real-time examples
  • Key Essentials of Power Q&A
  • Power BI Q&A with Power BI Embedded

Power BI is the most prominently used Data Visualization tool in the field of business analytics. It is a business analytics solution developed by Microsoft that is mainly used to transform and analyze enterprise data into rich visuals in the form of reports or dashboards. Power BI report server is a web portal that is used to manage and manage KPIs and reports. Report Server provides users access to enterprise reports and interactive reports.

Topics Covered in this module are:

  • Introduction to Power BI Report Server
  • How to install the Power BI Report Server
  • Limitations of Power BI 
  • How to create Power BI reports
  • Different types of reports
  • What are KPIs
  • Key Features of Power BI Report Server
  • New Releases in Power BI Report Server
  • Power BI Report Server Limitations

Power BI Administration role is provided for the users who require privilege on Power BI Admin Portal. Power BI helps organizations view their data entirely through a single glass pane. Reports, graphs, Dashboards are the key elements of Power BI that are used to turn unrelated data sources into useful insights of data. The Power BI admin will have full control over the Power BI tenant. You will also learn in detail about admin access, navigating admin, and configuring the governance policies.

Topics Covered in this module are:

  • Introduction to Power BI Administration
  • Key members in Power BI Administration
  • Power BI Service Administrator
  • What is Power BI Port
  • Power platform Administrator
  • Run Power BI as an Administrator
  • Managing Groups
  • Row-level Security
  • Key ELements of Power BI

Power Pivot is an essential feature in Power BI that is used to import, manipulate, and analyze huge loads of data without any loss. Power Pivot tables are used to mix up data from different tables. It is also considered as the data modeling technique that is used to create data models. The Power Pivot in Excel is used to perform powerful data analysis.

Topics Covered in this module are:

  • What is Power Pivot
  • Need for Power Pivot
  • Power Query vs Power Pivot
  • Pivot Tables
  • Pivot Charts
  • Embedding Power Pivot in Power BI Desktop
  • Overview of the Data Model
  • Power Pivot real-time examples
  • Integrating Data from multiple tables
All the above concepts will be covered in Our Power BI Course. You will become a master in all the concepts of Power BI because our trainers will make you learn very effectively. Our main goal is to make students satisfied with the training and place them in the top companies.

Like the Course Curriculum?

Or need customized syllabus? Enroll Now & personalized it!

Power BI Course Features

CourseJet offers the best Power BI online training with advanced features. Our world-class features will provide zeal for the learners to enroll for top training courses.

Instructor-led Sessions

30 to 45 Hrs of Power BI Online Live Instructor-Led Classes.

Expertise Faculties

Our Faculties are working Power BI Professionals in MNC Companies.

Certification & Job Assistance

After Successful completion Power BI course you will receive Globally Recognized CourseJet Certificate.

100% Job Oriented Training

Power BI Live project based on any real time scenarios.

Lifetime Access

You get lifetime access which includes Power BI class recordings and Materials.

Flexible Schedule

We will provide you Convenient Class Batches with lifetime access to our 24x7 online support team.

Power BI Certification Training

Get the Globally Recognized DataStage certification training from CourseJet under the guidance of DataStage Experts. CourseJet teaches you all the DataStage concepts with global standards.

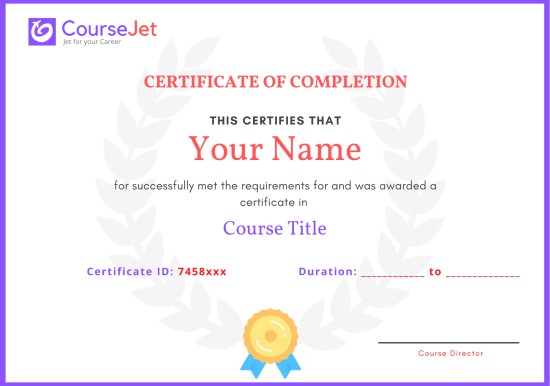
certificate

Power BI Certification Training Online helps learners develop technical knowledge relevant to Microsoft’s professional certification pathway for data analysts using Power BI. The primary Microsoft certification associated with Power BI data analysis is Microsoft Certified: Power BI Data Analyst Associate. Candidates earn this credential by passing the PL-300: Microsoft Power BI Data Analyst examination and meeting Microsoft’s applicable certification requirements.

The PL-300 examination assesses skills associated with preparing data, modelling data, visualising and analysing data, and managing and securing Power BI solutions. Candidates are expected to understand Power Query, DAX, relationships, semantic models, report development and Power BI Service. CourseJet’s live online instructor-led training can support preparation by introducing relevant technical concepts and practical reporting workflows. Learners can strengthen their understanding of data transformations, analytical calculations, interactive visualisations and report management.

However, Microsoft establishes its own examination objectives, registration procedures, assessment requirements and certification policies. Learners should review the current PL-300 study guide and official Microsoft Learn resources before attempting the examination. Any CourseJet course completion certificate, where issued, is separate from the Microsoft Certified: Power BI Data Analyst Associate credential. Completing CourseJet’s training does not automatically award Microsoft certification.

  • CourseJet’s Power BI Certification Training provides a structured approach to learning data analysis, business intelligence and interactive reporting using Microsoft Power BI.

  • The programme introduces Power Query, data modelling, DAX calculations, report visualisation and Power BI Service through live online instructor-led sessions.

  • Learners develop an understanding of how data is collected, transformed, organised and analysed to support business decisions. These technical capabilities are also relevant to the knowledge areas assessed in Microsoft’s PL-300 examination.

  • CourseJet’s small-batch approach provides opportunities to ask questions and clarify concepts such as DAX evaluation context, table relationships and data transformation.

  • One-to-one training is also available, subject to instructor schedules.

  • Learners preparing for Microsoft certification should review the latest official examination objectives and confirm the certification preparation resources available through CourseJet.

A CourseJet Power BI course completion certificate, where provided, documents participation in or completion of the training programme.CourseJet’s completion certificate is different from Microsoft’s official Power BI Data Analyst Associate certification. To obtain the Microsoft credential, candidates must meet Microsoft’s current certification requirements, including passing the applicable PL-300 examination.

CourseJet verification required: Confirm whether a completion certificate is issued, the required attendance, any internal assessments and the conditions for receiving it.

Completing CourseJet’s training does not automatically award Microsoft certification. Learners should verify the examination registration process, assessment requirements and any additional fees before enrolling.

A CourseJet Power BI completion certificate, where available, can provide evidence that a learner has undertaken training in Power BI data analysis and reporting technologies. Employers may consider training certificates alongside technical skills, practical reporting experience, analytical knowledge and interview performance.

CourseJet verification required: Confirm whether CourseJet’s completion certificate has independently verified international accreditation or formal recognition.

Microsoft Certified: Power BI Data Analyst Associate is a separate, vendor-issued professional credential. It demonstrates achievement of Microsoft’s applicable certification requirements and can be verified through Microsoft’s credential systems. Learners seeking a Microsoft-recognised qualification should follow the official PL-300 certification pathway and confirm current examination requirements directly with Microsoft.

Power BI Certification is designed and implemented by Microsoft to help the aspirants who want to build their professional career in BI Reporting. BI Certification demonstrates your expertise in visualizing data in graphs, reports, and excel. This certification exam is conducted to test your skills in visualizing and analyzing data with Power BI. Qualifying the Power BI certification exam will add value to your professional career.

Get personalized 1-1 course consultation

Career-Focused Course Material and Personal Coaching to get Job.

Power BI Projects

CourseJet not only provides you with the best Power BI training but also makes you work with real-world projects and case studies to help you gain practical knowledge.

  • Practical knowledge is very important to understand how things actually work. To put your all learning into action, you will be required to work on two industry-based live projects that will discuss the real-time use cases.
  • CourseJet Power BI Training will help you gain in-depth knowledge of all the essential concepts of Power BI through real-world examples and hands-on projects.
  • We make each and every individual work on Power BI real-time projects to face challenges during the learning period so it will be very helpful to solve problems arising in organization while in the job.
  • Working with real-time projects will make more efficient and you will get more doubts. This type of working procedure will help you achieve a lot more things in your career.

Develop a professional portfolio Now!

Complete real-time projects, to showcase your skills to employers.

Power BI Trainer Profile

You will learn the Power BI essentials from the expert’s trainers who hold 10+ years of real-time experience in handling diversified projects.

10+ Years Experienced

Our Power BI Trainers are more than 10+ Years of experience.

Working in Top MNCs

Our Power BI Trainers are Working in a top MNC company around the globe.

Trained 2000+ Students

Our Power BI Trainers are Trained more than 2000+ Students in Power BI Courses.

Certified Professionals

Our Power BI Trainers certified Power BI Professionals with Strong Practical Knowledge.

Certification Guidance

Our Power BI Trainers will help you in getting International Certification if available.

Completed 700+ Batches

In CourseJet, we already finished many batches successfully with certifications.

Talk to our course Trainer now

Enroll now and get a free consultation with the trainer.

Power BI Training Reviews

Our Best Power BI Teaching methodology has acquired millions of students around the globe and they shared their success stories in the form of reviews.

✎ 2765
Total Reviews
✪ 4.9
Review score
✉ 99%
Course Completions

Power BI Jobs & Placements

CourseJet has tie-up with small, medium, and large scale corporations across the world. We provide you with the complete placement assistance by forwarding your resume to the companies we tie-up with.

Power BI skills are relevant to professional opportunities involving data analytics, business intelligence development, financial reporting and management information systems. Organisations in banking, retail, healthcare, manufacturing, education and technology use business intelligence platforms to monitor performance, analyse operational data and support decision-making.

Professionals with Power BI knowledge may explore positions such as Power BI Developer, Data Analyst, Business Intelligence Analyst, Reporting Analyst, MIS Analyst and Business Intelligence Developer. Employers may seek knowledge of Power BI Desktop, Power Query, DAX, SQL, semantic modelling, report visualisation and Power BI Service. Understanding data warehousing, business requirements and analytical problem-solving can provide additional advantages.

CourseJet’s live online instructor-led training helps learners understand the technologies and workflows associated with these responsibilities. Participants can strengthen their professional readiness by studying data transformations, model development, analytical calculations and reporting practices. Building a portfolio containing sales dashboards, financial reports, operational analysis and documented Power BI models can help demonstrate relevant capabilities during recruitment.

CourseJet placement assistance, interview preparation, CV guidance, career mentoring and job opportunity updates: Confirm Available Career Support Services.  Learners should enquire about the specific career-related services included in their training programme. Employment opportunities depend on individual skills, practical experience and employer requirements.

CourseJet’s Power BI Online Training focuses on developing technical knowledge relevant to data analysis, business intelligence and reporting careers. Learners can strengthen their understanding of Power Query, DAX, semantic models, interactive dashboards and Power BI Service.

[CourseJet verification required: Confirm whether placement assistance includes CV preparation, mock interviews, career counselling, recruitment referrals or job opportunity updates. Any eligibility requirements and duration of support should also be confirmed.]

Candidates preparing for Power BI interviews should understand data modelling, DAX calculations, SQL queries, report optimisation and business reporting scenarios. Any placement assistance provided by CourseJet should be considered support for career preparation rather than a guarantee of employment, interviews or job offers.

Learning Power BI can help individuals prepare for careers in business intelligence, data analysis and reporting, particularly when combined with strong analytical and database skills. Entry-level candidates may explore Junior Data Analyst, Reporting Analyst or Business Intelligence Analyst positions. Professionals with relevant experience may pursue Power BI Developer, Senior BI Developer, Data Analytics Consultant or Business Intelligence Engineer roles.

Employers commonly assess Power Query transformations, data modelling, DAX calculations, SQL knowledge, dashboard design and analytical problem-solving abilities. Practical experience is particularly valuable. Candidates should be able to explain how they prepare datasets, create semantic models, develop calculations and design reports that answer business questions.

Knowledge of Excel, SQL, statistics, Microsoft Fabric and cloud-based data platforms can strengthen career readiness. The Microsoft PL-300 certification may provide additional evidence of Power BI knowledge, but certification and training alone do not guarantee employment. Recruitment outcomes depend on practical capabilities, experience and employer expectations.

The salary of a Power BI professional varies according to country, city, experience, industry, technical specialisation and job responsibilities. Entry-level Data Analyst and Reporting Analyst positions generally have different compensation structures from experienced Power BI Developer, Senior Business Intelligence Developer and Analytics Consultant roles.

Professionals with advanced knowledge of DAX, Power Query, SQL, semantic modelling, report optimisation and Power BI Service may qualify for more specialised responsibilities. Additional skills in Microsoft Fabric, data engineering, cloud platforms, statistics and business analysis can influence earning potential.

Employers also consider practical project experience, communication skills, analytical problem-solving abilities and the complexity of reporting solutions developed. Microsoft certification may strengthen a professional profile, but it does not independently determine salary.

Because no target employment location or verified current salary dataset has been specified, a reliable average salary figure cannot be provided. Learners should consult recent salary information for their preferred country, city and Power BI job role.

Get your dream job in a month

Join the program to meet the Industries recruitment process

FAQ of Power BI Training

CourseJet FAQs are designed to clear most of your doubts and also help you build power in yourself to get clarified with the rest of doubts related to that course.

Yes, We offering group discounts when you join as more than three people 10% to 30% Price discount will be provided. We also have a referral discount for those who have already enrolled in our training. Terms and conditions apply.

Yes, we will share sample recordings of this course which was recorded during the live class. It will give you a good idea about the classes and the training sessions. 

You need not worry if you miss a class because CourseJet provides live recordings of the sessions so that you can go through them just before you attend the next session. If it is one to one training classes then will be rescheduled at your convenience. 

CourseJet is the Best Online Training platform, it provides high-class services for the learners. CourseJet provides Job Assistance for the learners and also helps them in getting placed in top MNCs around the world. CourseJet offers 24/7 support, best course material, and videos.

The different modes of training offered by CourseJet are as follows:

  • Instructor-led training
  • Corporate training
  • Self-paced training

Upon successful completion of this training, you will receive Course Completion Certification from CourseJet. It is a Globally Recognized Certification in top MNCs across the world. CourseJet certification is also recommended by top experts.

Yes, CourseJet provides 100% job assistance for the learners to help them get placed in top MNCs. Our trainers will help to create perfect resumes, will share the top interview questions, tutorials and necessary software installation guides.

CourseJet Job assistance program will train you to achieve your dream job by referring your resume to tied up companies and also assisting with preparing your resumes and providing important interview questions. We will help you in the all dimension between you and recruiters companies and the final selection decisions is always depends on the recruiter by the candidate’s performance in the interview. 

Yes, it is possible by paying some extra charges and can continue learning the course from the next batch.

The system requirements required to attend this training are:

  • An operating system such as Mac OS, Windows, Linux.
  • 4 GB RAM
  • Dual-core CPU

We are Experts in corporate training by Upgrading your team member’s skills. So, please get in touch with our team through fillup the corporate training Form or contact us via our Mail Id or Phone. 

Payments can be made using any of the following options like Debit Card / Credit Card, American Express, Master Card, or PayPal and a receipt of the same will be issued to you automatically via email. 

Looking for Group Discounts?

Enroll now and get a group discounts upto 30%

Related Courses

CourseJet provides training for a large number of courses. We have more than 250+ courses on our website and also provide assistance for the participants in suggesting the best training course.

© 2026 Digivigor Pvt. Ltd. All rights Reserved. The certification names are the trademarks of their respective owners. All trademarks are properties of their respective owners. View Our Disclaimer for more details. 

🚀Fill Up & Get Free Quote